
EV Charging Stations vs. Gas Stations: Comparing Density in the U.S.
As EV adoption continues to rise, we must consider the availability of charging stations. See which states are accounting for EV adoption the best here.

The rise of electric vehicles (EVs) is bringing about a significant shift in the transportation landscape. From 2017 to 2021, the U.S. saw a 286% increase in EV registrations nationwide going from just over 377,000 to nearly 1.5 million. Additionally, the Bureau of Labor Statistics recently cited forecasts that project EV sales reaching 40% of total passenger car sales by 2030. As EV adoption continues to accelerate, one critical aspect that needs careful consideration is the accessibility and availability of EV charging stations.
Steps have been taken over the years to ensure a network of accessible charging stations is available for those who need it. From April 2020 to April 2023, alternative fueling stations are up nearly 90%, according to the Bureau of Transportation Statistics. While we’ve seen substantial increases regarding EV usage and charging accessibility in recent years, where those infrastructure improvements are happening is another question altogether.
That’s why the team at Coast used data from the U.S. Department of Energy and the U.S. Department of Transportation to explore the state of electric vehicle charging infrastructure in the U.S. We also compared it with the more well-established network of gas stations across the country to see how much further we have to go regarding EV charging access.
By examining the differences in charging density and gas station density across the country, we can gain valuable insights into the progress, challenges, and potential future implications of transitioning to cleaner and more sustainable passenger vehicles.
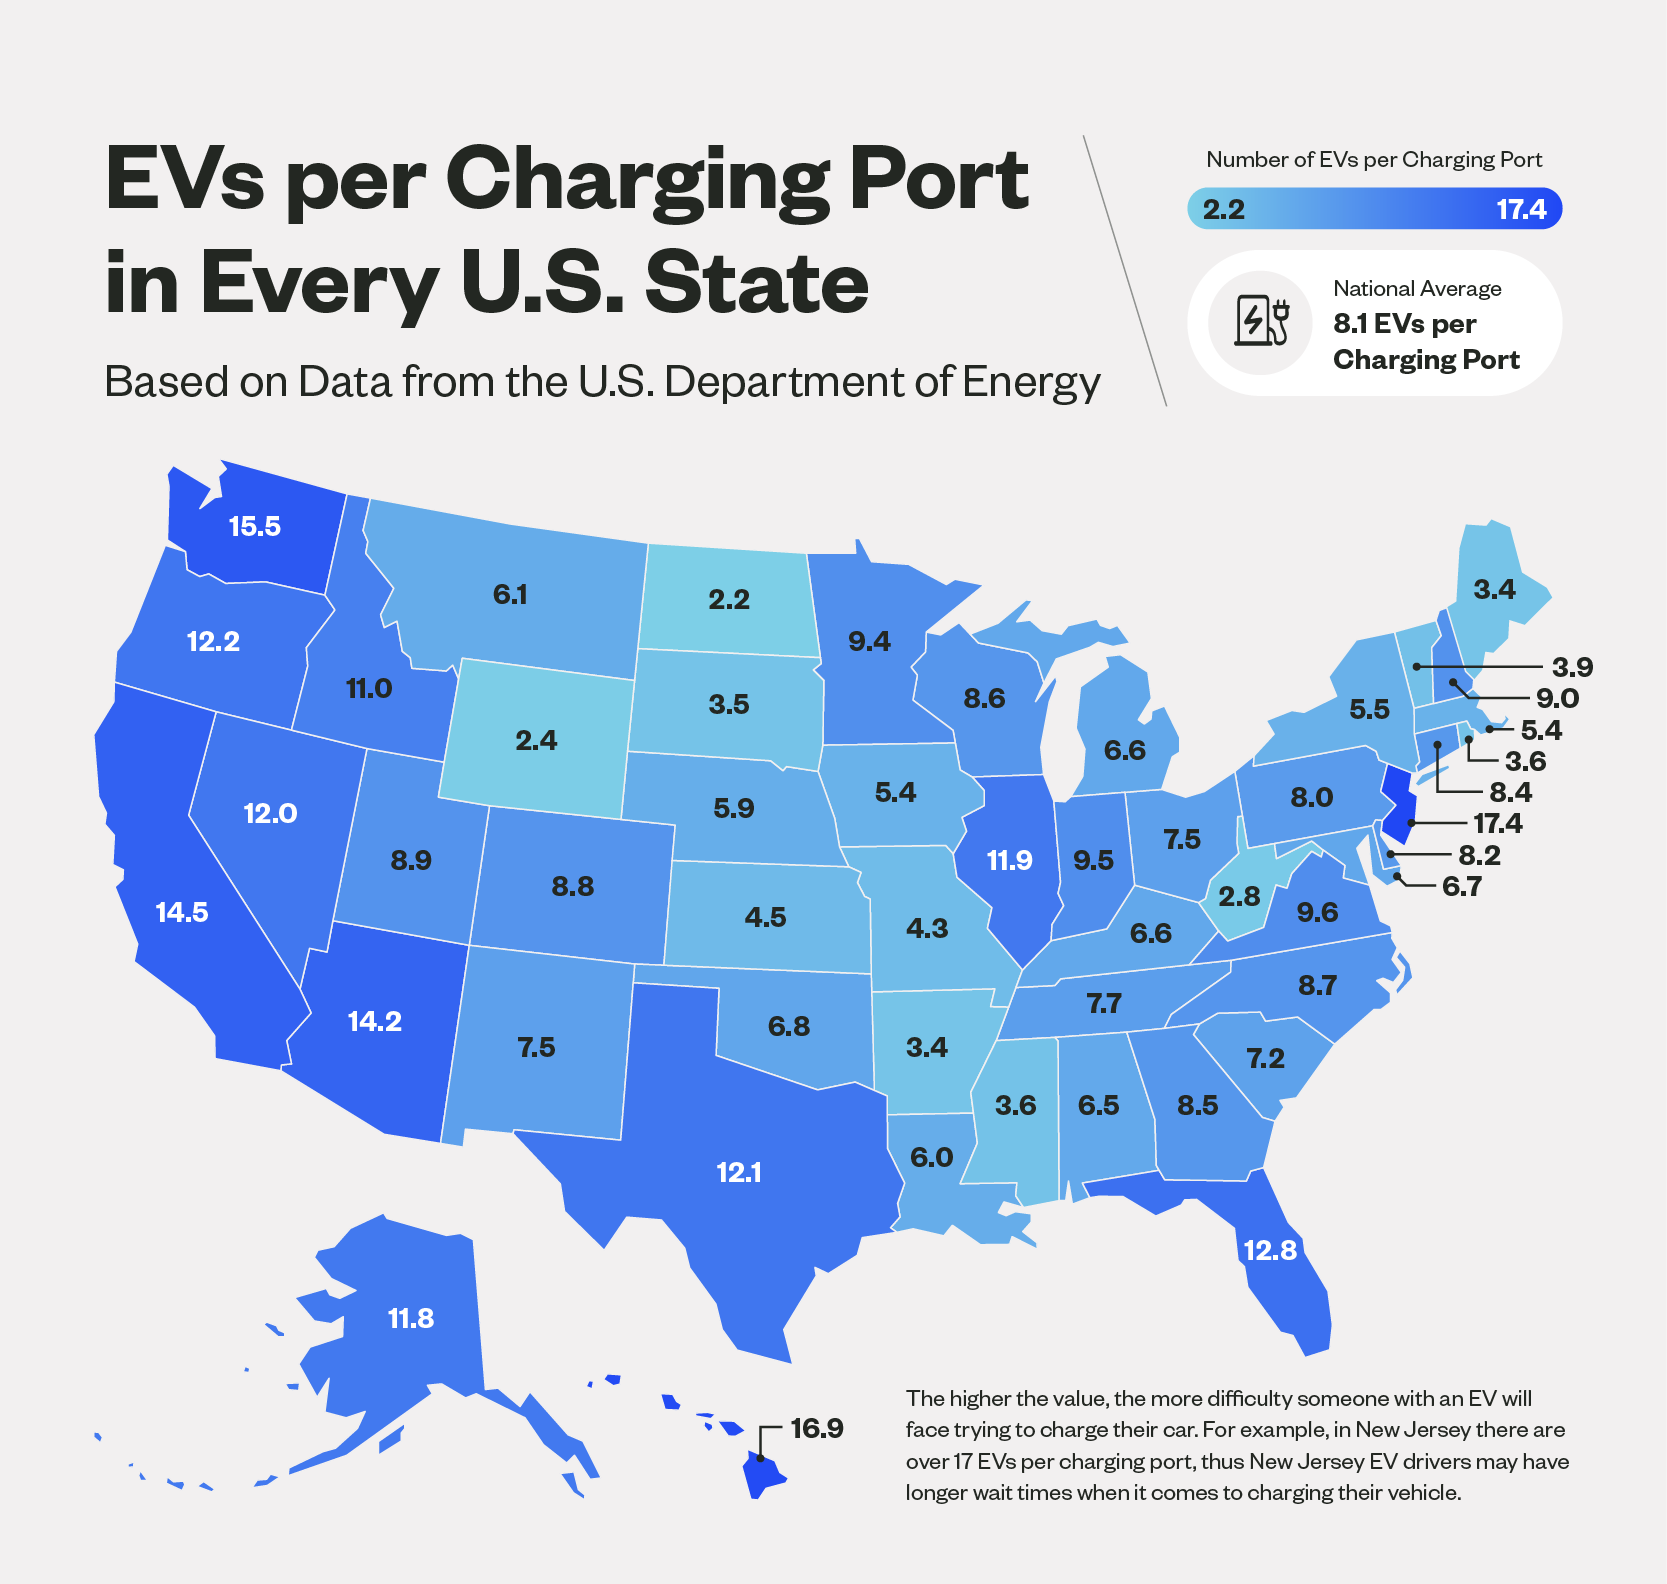
Electric vehicle charging access varies across the country. One of the most straightforward ways to understand that variability is by comparing EV adoption to available charging ports. States with more EVs on the road will need greater access to charging ports.
New Jersey, Hawaii, and Washington are notable for having the highest number of EVs per charging port, which could present a significant challenge for EV drivers seeking access to charging facilities. New Jersey is a prime example, where the ratio exceeds 17 EVs per charging port, resulting in the potential of prolonged wait times and increased difficulty for drivers looking to charge their vehicles.
States with a higher concentration of EVs per charging port could create an imbalance between the demand for charging infrastructure and the availability of supply, resulting in extended waiting periods and heightened competition among EV owners for access to chargers.
These states are also the ones that should be more carefully considering the future of their EV charging networks. New Jersey, for example, added about 1,500 charging ports from 2021 to 2023 (an increase of 58% in just a two-year span). Charging port accessibility in Hawaii and Washington hasn’t been quite as severe as the states have increased their number of charging ports by 18% and 25%, respectively.

Taking a closer look at electric vehicle usage and charging density, we can see that there are some major discrepancies when it comes to supply and demand in some states.
Nevada, for example, stands out with 49% more EVs per vehicle registration than the national average. However, those planning on purchasing an electric vehicle in Nevada might be hard-pressed to find a charging port. The state lags behind with 19% fewer EV ports per road mile than the national average.
Oregon also demonstrates a strong inclination towards EVs, with Oregonians boasting 56% more EVs per vehicle registration than the national average. However, a similar challenge arises in Oregon’s charging accessibility, as the state has 14% fewer EV ports per road mile than the national average.
Conversely, Rhode Island has 26% fewer EVs per vehicle registration than the national average, but the state surprisingly has an impressive 205% more EV ports per road mile than the national average.
Similarly, Maine demonstrates a lower EV adoption rate with 47% fewer EVs per vehicle registration than the national average. The state does, however, have a slight advantage when it comes to charging density, with 5% more EV ports per road mile than the national average.
While Nevadans and Oregonians won’t have to sweat finding a charging port for their vehicle too much, drivers in states like Rhode Island and Maine might want to plan a little further ahead to make sure they have enough charge before setting off.

Next, we’ll examine the relationship between gas vehicle usage and fueling density and focus on the states where the numbers don’t quite match up. Since gas vehicles are much more common than electric vehicles, the changes by state aren’t quite as stark as they are when it comes to EV charging.
Nevada and West Virginia emerge as states with slightly higher gas vehicle ridership than the national average. Both, however, have surprisingly sparse access to gas pumps compared to roadway miles.
Despite having 2% more gas vehicles per vehicle registration than the national average, Nevada faces a significant challenge in fueling accessibility, with 37% fewer gas pumps per road mile than the national average.
Similarly, West Virginia showcases a slight increase of 1% in gas vehicles per vehicle registration compared to the national average. The state also experiences a deficiency in fueling density, with 6% fewer gas pumps per road mile than the national average.
Conversely, Louisiana and Texas demonstrate lower gas vehicle ridership relative to the number of gas pumps available.
Louisiana has 2% fewer gas vehicles per vehicle registration than the national average. However, the state surprisingly boasts a significantly higher fueling density, with 43% more gas pumps per road mile than the national average.
Similarly, Texans showcase a slightly lower gas vehicle adoption rate, with 2% fewer gas vehicles per vehicle registration than the national average but 32% more gas pumps per road mile than the national average.
The U.S. averages about 104 gas pumps per 1,000 road miles, compared to just 22 EV charging ports. While the discrepancy between the two types of energy is evident, some parts of the country are preparing themselves for an increase in EV ownership. Next, we’ll take a look at states where EV charging ports have outpaced gas pumps per square mile.
When comparing the EV charging infrastructure to gas stations across the United States, several states stand out for surpassing the number of EV charging stations per square mile compared to gas stations.
Residents in the following nine states may want to consider investing in an EV, as these states demonstrate a higher density of EV charging opportunities than traditional gas stations: Massachusetts, Rhode Island, California, Hawaii, Maryland, Colorado, Oregon, Utah, and Washington.
Among the top nine, three states stand out for their significant margin of EV charging stations surpassing the number of gas stations.
Topping the list is Massachusetts, where EV stations exceed gas stations by the largest margin. In Massachusetts, there are 31.4 EV charging stations per 100 square miles and only 18.4 gas stations per 100 square miles. Rhode Island and California follow closely behind, as both states provide residents with extensive charging networks to reinforce their commitments to cleaner transportation alternatives.
Wondering how your state stacks up when it comes to EV charging and gas car fueling density? View the full dataset if you want to dive into the details.
While EV adoption continues to surge, ensuring convenient and accessible charging options is crucial for further growth and widespread acceptance of electric vehicles. The transition to electric transportation requires a concerted effort to build a robust charging infrastructure.
Different government agencies and transportation companies are helping lead this charge. The Infrastructure Investment and Jobs Act allocated $7.5 billion to building out a nationwide charging network in November 2021, and it was recently announced that Tesla’s network of Superchargers is now open to non-Tesla EVs.
As more and more Americans see EVs as a viable transportation option going forward, plans will need to be developed to make charging more accessible for new EV owners.
If your fleets are already prepared for the EV boom, companies like Coast offer an all-in-one fuel card solution that not only streamlines fleet management but also simplifies employee expense management. By leveraging Coast’s platform, businesses can optimize their EV fleets, track charging expenses, and streamline administrative tasks associated with managing a fleet of electric vehicles.
To find the density of electric vehicle (EV) charging ports vs. gas station pumps, we pulled data on the number of EV charging ports from the U.S. Department of Energy and the number of gas stations from the U.S. Census Bureau. We positioned the number of EV charging opportunities and gas stations against the total number of roadway miles, vehicle registrations, and square miles in every state to allow for accurate comparisons from state to state. The number of road miles per state is based on data from the U.S. Department of Transportation.
First, we found the states where EV drivers might have the toughest time finding a charging station based on EV registrations and EV charging port accessibility.
Then, we created a density metric for EV charging ports and gas station pumps based on each type of vehicle’s usage and access to fueling and charging opportunities in each state. Once we had those numbers, we were able to compare the state averages to the national average in terms of both vehicle usage and fueling capacity to see where usage and fueling capacity don’t match up.
Finally, we were able to determine which states have better electric vehicle charging density than gas station density.
Our assumptions for the number of gas pumps in every state come from the number of gas stations and the average number of pumps per station from Enel X.
